Have you ever wondered if there is a way in which you could analyse the performance of your React application? There is a way by using the Profiler. It’s extremely easy to use and super lightweight.
Profiler API
All you need to do to use it is to import it from React and wrap the part of the JSX tree that you’d like to have analysed. Let’s write a simple counter application and analyse it!
import { useState } from 'react';

const Counter = () => {
  const [count, setCount] = useState(0)
  return (
    <div>
	<h1>{count}</h1>
	<button onClick={() => setCount(count + 1)}>Increment by 1</button>
    </div>
  )
}

export default Counter
We then import this counter into our App.js
import Counter from './Counter'

function App() {
  return (
    <div style={{ margin: '50px' }}>
      <Counter />
    </div>
  );
}

export default App;
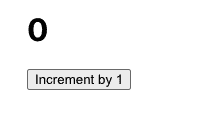
Which then renders the following app to the page.

Let’s now import the Profiler in App.js and wrap the Counter.
import { Profiler } from 'react';
import Counter from './Counter'

const log = (id, phase, actualTime, baseTime, startTime, commitTime, interactions) => {
  console.table({ id, phase, actualTime, baseTime, startTime, commitTime, interactions })
}

function App() {
  return (
    <div style={{ margin: '50px' }}>
      <Profiler id="Counter" onRender={log}>
        <Counter />
      </Profiler>
    </div>
  );
}

export default App;
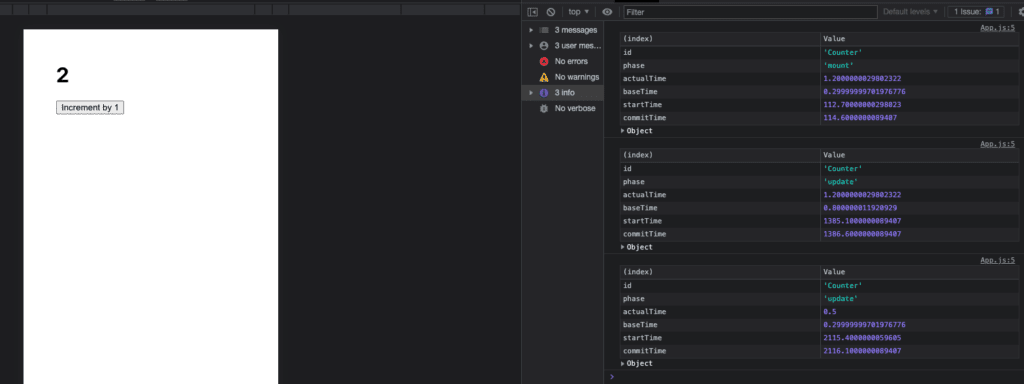
As you can see the profiler takes the props id, which is used for identification in case you’re using multiple Profilers and onRender, which is a callback that receives some useful arguments that we can then inspect.
To help us see this data better I’ve written a log function that will output it to the console for us to inspect.

For a more thorough explanation of what those mean make sure to check out the React Profiler documentation.
💬 Leave a comment