In this tutorial, we will look at how to use Chart.js with React, we are going to display different types of charts – Line, Pie, and Bar charts. Then we will learn how we can pass data into these charts.
What is Chart.js?
Chart.js is the most popular library used for creating charts.
There are many libraries available for creating charts in React but Chart.js is well maintained, easier to use, and has great documentation.
Installing Chart.js
Get started by creating react app on your machine or simply open your browser and visit react.new
A new CodeSandbox environment will open with React project setup. Next Install Chart.js
npm install --save react-chartjs-2 chart.jsCreating charts – line, bar, and pie charts
Let’s look at some examples of charts.
We will create different react components for charts just for the simplicity of this tutorial.
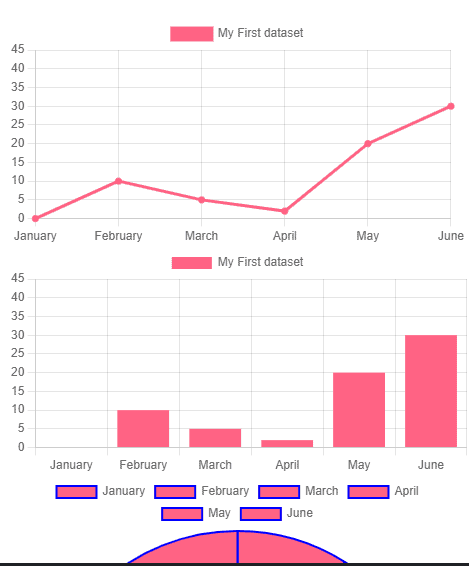
1. Creating Line Chart with Chart.js
Create new folder components, Inside create a new file LineChart.js and add the following code to it:
We start by importing Chart and Line from Chart.js and react-chartjs-2 respectively.
All charts require labels to name each bar on the graph, and it takes data as props to display information on the graph. The data prop has datasets that hold properties of the chart such as height, width, and color of the graphs. We can edit datasets to change backgroundColor, borderColor, etc of graph.
// ./components/LineChart.js

import React from "react";
import Chart from "chart.js/auto";
import { Line } from "react-chartjs-2";

const labels = ["January", "February", "March", "April", "May", "June"];

const data = {
  labels: labels,
  datasets: [
    {
      label: "My First dataset",
      backgroundColor: "rgb(255, 99, 132)",
      borderColor: "rgb(255, 99, 132)",
      data: [0, 10, 5, 2, 20, 30, 45],
    },
  ],
};

const LineChart = () => {
  return (
    <div>
      <Line data={data} />
    </div>
  );
};

export default LineChart;
2. Bar Chart
// ./components/BarChart.js

import React from "react";
import Chart from "chart.js/auto";
import { Bar } from "react-chartjs-2";

const BarChart = () => {
  const labels = ["January", "February", "March", "April", "May", "June"];
  const data = {
    labels: labels,
    datasets: [
      {
        label: "My First dataset",
        backgroundColor: "rgb(255, 99, 132)",
        borderColor: "rgb(255, 99, 132)",
        data: [0, 10, 5, 2, 20, 30, 45],
      },
    ],
  };
  return (
    <div>
      <Bar data={data} />
    </div>
  );
};

export default BarChart;
Similarly, all types of charts have the same syntax. Every graph requires labels and datasets to display information on the chart.
3. Pie Chart
// ./components/PieChart.js
import React from "react";
import Chart from "chart.js/auto";
import { Pie } from "react-chartjs-2";
const labels = ["January", "February", "March", "April", "May", "June"];
const data = {
  labels: labels,
  datasets: [
    {
      label: "My First dataset",
      backgroundColor: "rgb(255, 99, 132)",
      borderColor: "rgb(0,0,255)",
      data: [0, 10, 5, 2, 20, 30, 45],
    },
  ],
};
const PieChart = () => {
  return (
    <div>
      <Pie data={data} />
    </div>
  );
};
export default PieChart;
Now, there’s just one thing left that is we need to import all these components in the App.js file. Import all the components in App.js file.
// App.js
import BarChart from "./components/BarChart";
import LineChart from "./components/LineChart";
import PieChart from "./components/PieChart";
function App() {
  return (
    <div>
      <LineChart />
      <BarChart />
      <PieChart />
    </div>
  );
}
export default App;
After running your React app you should see charts being displayed.
How to pass data into charts?
Now, let’s pass some data which actually makes sense. Let’s add static data of Most Popular Programming Languages to learn in 2022. We will add this data in a Pie chart.
Add the following code in the PieChart.js file:
import { Pie } from "react-chartjs-2";
import Chart from "chart.js/auto";
export default function PieChart() {
  const data = {
    labels: ["Go", "Python", "Kotlin", "JavaScript", "R", "Swift"],
    datasets: [
      {
        label: "# of Votes",
        data: [35, 25, 22, 20, 18, 15],
        backgroundColor: [
          "#007D9C",
          "#244D70",
          "#D123B3",
          "#F7E018",
          "#fff",
          "#FE452A",
        ],
        borderColor: [
          "rgba(255,99,132,1)",
          "rgba(54, 162, 235, 1)",
          "rgba(255, 206, 86, 1)",
          "rgba(75, 192, 192, 1)",
          "rgba(153, 102, 255, 1)",
          "rgba(255, 159, 64, 1)",
        ],
        borderWidth: 1,
      },
    ],
  };
  return (
    <div style={{ width: 650, textAlign: "center" }}>
      <h1 style={{ fontFamily: "monospace" }}>
        Most Popular Programming languages to learn in 2022
      </h1>
      <Pie data={data} width={50} height={50} />
    </div>
  );
}
Save the file and jump over to your browser, and you can see how simple that was to display some data on charts.
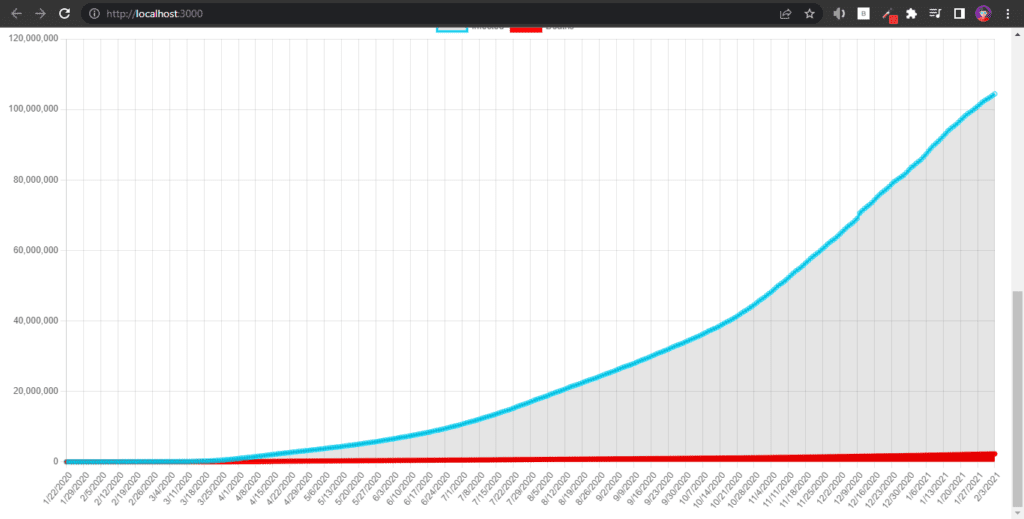
How to add dynamic data into charts?
Now that we have learned to how to display static data on charts, We will learn how to add some realtime data into charts. We will pull some data from an Covid19-API and display that data on a line chart.
Let’s fetch some data from Covid 19 API, start by installing axios.
npm install axiosWith that completed create a new file Data.js in components folder. We will be fetching all the data in that file. Open Data.js file and add the following code:
import axios from "axios";
const url = "https://covid19.mathdro.id/api";
export const fetchData = async (country) => {
  let changeableUrl = url;
  if (country) {
    changeableUrl = `${url}/countries/${country}`;
  }
  try {
    const {
      data: { confirmed, recovered, deaths, lastUpdate },
    } = await axios.get(changeableUrl);
    const modifiedData = { confirmed, recovered, deaths, lastUpdate };
    return modifiedData;
  } catch (err) {
    console.log(err);
  }
};
export const fetchDailyData = async () => {
  try {
    const { data } = await axios.get(`${url}/daily`);
    const modifiedData = data.map((dailyData) => ({
      confirmed: dailyData.confirmed.total,
      deaths: dailyData.deaths.total,
      date: dailyData.reportDate,
    }));
    return modifiedData;
  } catch (err) {
    console.log(err);
  }
};
We have just fetched the data from this API “https://covid19.mathdro.id/api”. Unfortunately they have stopped maintaining this API but it does the job for this tutorial which is awesome.
Now we have to display this data so open your LineChart.js file and add the following code:
import React, { useEffect, useState } from "react";
import { fetchDailyData } from "./Data";
import Chart from "chart.js/auto";
import { Line } from "react-chartjs-2";

const LineChart = () => {
  const [dailyData, setDailyData] = useState([]);

  const fetchApi = async () => {
    const dailyData = await fetchDailyData();
    setDailyData(dailyData);
  };

  useEffect(() => {
    fetchApi();
  }, []);

  const lineChart = dailyData[0] ? (
    <Line
      data={{
        labels: dailyData.map(({ date }) =>
          new Date(date).toLocaleDateString()
        ),
        datasets: [
          {
            data: dailyData.map((data) => data.confirmed),
            label: "Infected",
            borderColor: "rgb(0, 217, 255)",
            fill: true,
          },
          {
            data: dailyData.map((data) => data.deaths),
            label: "Deaths",
            borderColor: "red",
            backgroundColor: "rgb(255, 0, 0)",
            fill: true,
          },
        ],
      }}
    />
  ) : null;

  return (
    <>
      <div>{lineChart}</div>
    </>
  );
};

export default LineChart;
We have created a new useState hook with variable dailyData that will hold all the data we fetched earlier in Data.js file, then we have a fetchApi function which updates the value of dailyData. Next, we updated our datasets prop with the covid-19 data.
Now, we have got dynamic data displayed to our chart.
Thank you so much for reading this tutorial. I really hope you understood everything that was explained in the tutorial.
Feel free to comment if you have any questions or If you have any suggestions. If you want to request any article for a particular topic contact through the about page. I would love to hear from you.
💬 Leave a comment